Explore Visualization Power of Neo4j Browser
May 3: Sun Day, One Month Graph Challenge
Welcome word
In this series of small posts I do one simple graph daily. Domain model of graph somehow related to day’s history, some historical event, celebration or person. I do this challenge to learn Neo4j Data Modeling and Cypher. Every day. One month. Follow me. Maybe you will be inspired and next month would be yours One Month Graph Challenge. #OMGChallenge
Domain model
Today not a Sunday, but International Sun Day. I like simplicity and beauty, that names of weekdays have related to the cosmos: Sun for Sunday, Moon for Monday, Mars for Tuesday, Mercury for Wednesday, Jupiter for Thursday, Venus for Friday and Saturn for Saturday. Today would be nice to use a chance to create a small graph for such a big thing like Solar System.
Graph
Create a Solar System of Sun and planets (to simplify things, in text below term “planets” includes Sun):
The “sizeXEarth” property is a proportion of actual size of the planet to the size of Earth (5.972 × 10²⁴), same for “massXEarth” based on Earth mass.
In next example APOC used. One click between install and use. System mean following of some rules, “order” is one of them and can be represented as a relation between planets:

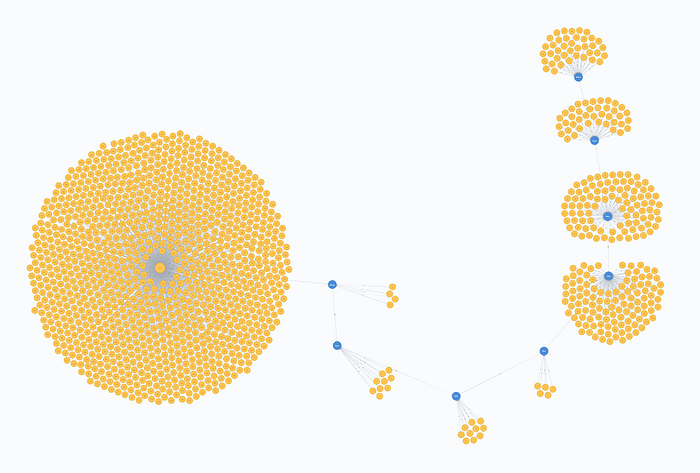
We can also try to visualize a size of each planet by chunks related to each of them. Because the size of some planets smaller than size of Earth (for example: 0.4, 0.9 vs 1). Let’s increase all sizes x10 and create appropriate amount of chunks:
Resume
When you touch cosmos, all the number and scales are just incredible. Macro world is something too huge to visualize on laptop screen. Interesting, what else can be converted from numbers and scales into nodes and relations? Mass? Yep, it could be good to try as well. Your turn!